FEA Simulations of MACE Experimental Demonstrator
Standby Mode Magnetic Field: Prior to discharge, the peak magnetic flux density occurs near the corners of the superconducting coil bundle. At the surface of the HTS primary coil, ISIT saw a magnetic field strength a little above the 2 T that was originally calculated (Figure 12). Also, Maxwell3D gives the stored magnetic energy as 8.9 kJ in the half-symmetry model, so the magnetic energy stored by this coil is 17.8 kJ, very close to the design goal of 18 kJ. ISIT noted that the boundaries of the region around the model can affect the energy storage, and ISIT expected that the actual energy storage to be slightly larger.
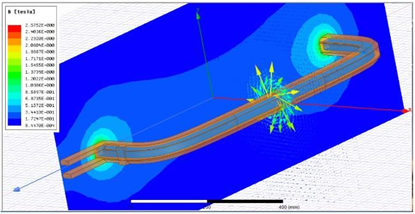
Figure 12. Steady state magnetic field simulation of MACE coil prior to discharge
Transient Behavior During Discharge: To evaluate primary to secondary coupling in the MACE system and to provide a reasonable starting mesh for the transient discharge case, an eddy current simulation was performed using a 1 kHz 800 A current in the superconducting coil. A stranded superconducting coil is assumed, while the load coil is assumed to be solid copper that will exhibit skin effect current distribution. The load coil is assumed to be connected to a 100 µΩ load resistance which will dominate the current magnitude induced in that winding. A color magnitude plot of the current density in the load coil winding reveals the skin effect distribution (Figure 13). The dynamic range of the plot is somewhat limited, but one can clearly see that the load connection leads on the right side support a higher current density than the main structure of the load coil. This will be addressed in the final design analysis.
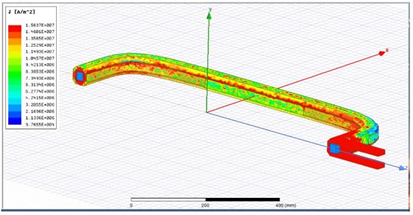
Figure 13. Skin effects of current distribution
The magnetic field distribution and current distribution was modeled at 1 msec after discharge (Figure 14). Note that the magnetic field strength has already begun to diminish as energy is transferred to the external load. The “parallel line” construction of the output leads contributes to the B field distribution in the right-hand region of the plot. The current density distribution in the output coil shows higher current density next to the superconducting coil and on the inner surface of the coil due to the eddy current redistribution. The output leads show a high current density also, as was seen in the eddy current simulations; this is primarily due to the high B field density near those leads.
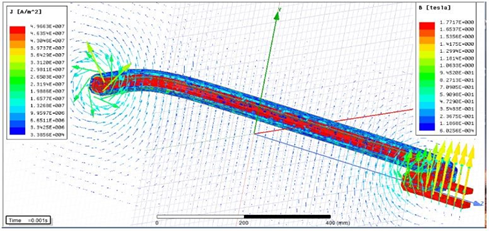
Figure 14. Transient simulation magnetic fields and skin effects at 1 msec into discharge
These results, together with the other Maxwell3D finite element simulations described above, confirm the initial design parameters and circuit simulation results for the MACE demo coil configuration.